Client X introduces an updated system for research results
Following several months of designing, developing and testing, on June 5, 2015 we launched an upgraded version of the online platform for research results. The entire interface has been changed, so it could meet the highest needs of the company’s clients and also, make the access through mobile devices easier.
Many new result visualizations and processing options have been implemented. Most significantly:
- Dashboard and more charts;
- Exporting more types of data – now in PDF and HTML, not only in Excel;
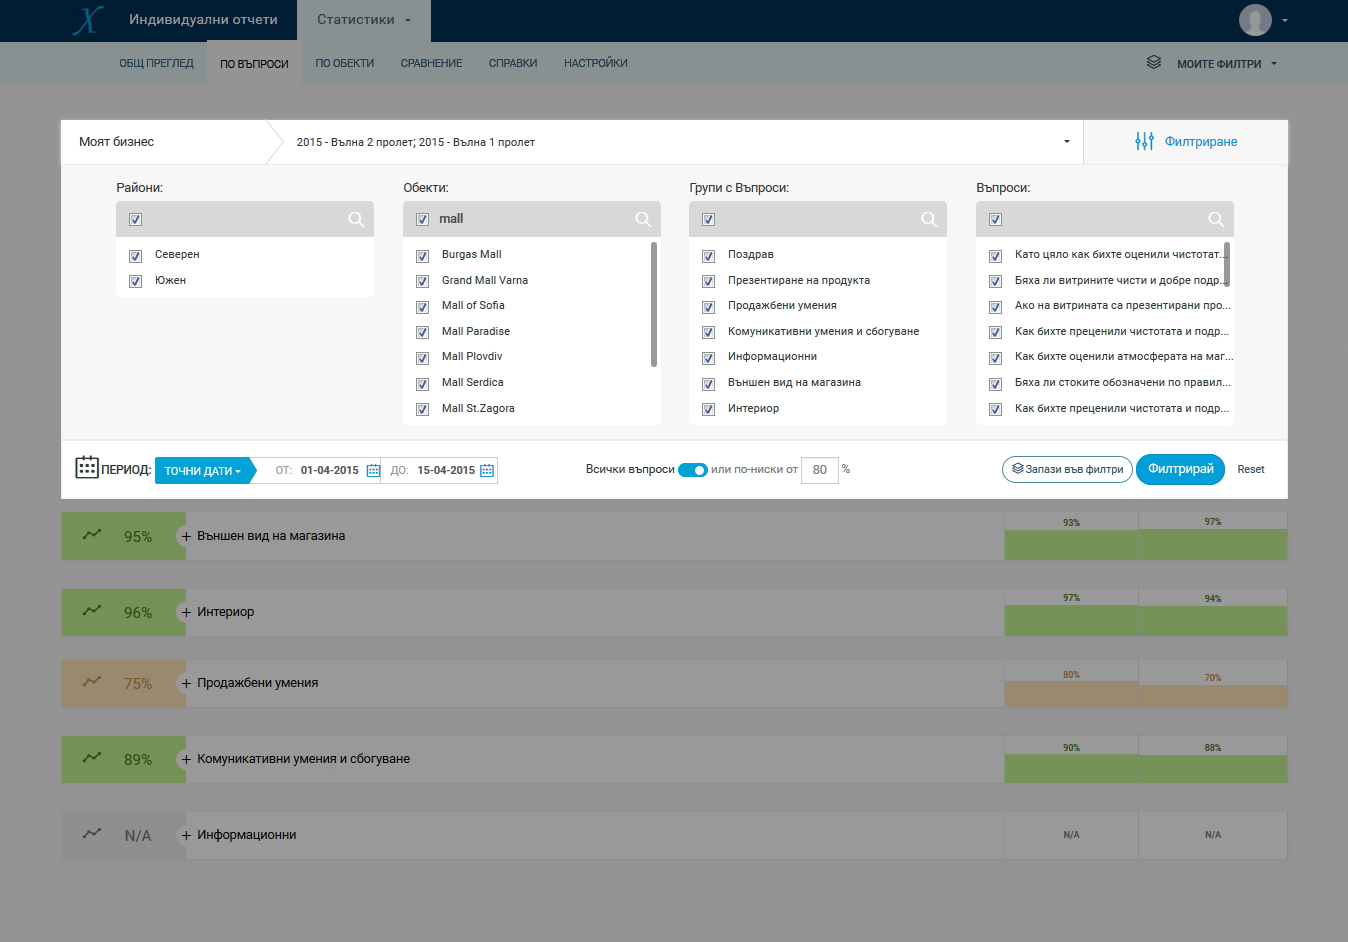
- A more powerful filter;
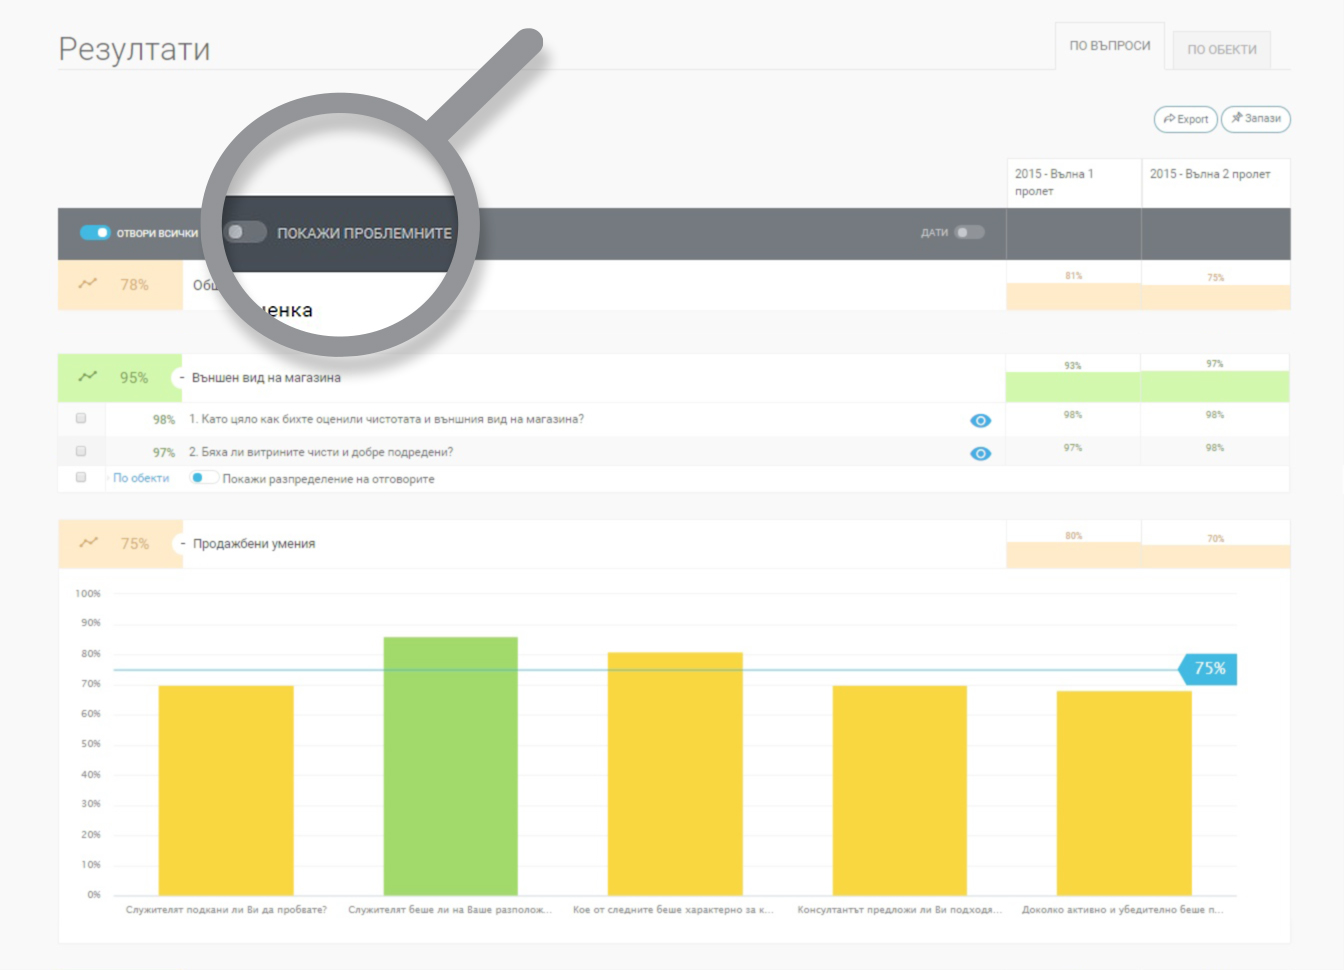
- Showing problematic questions or problematic locations only;
- Color coding of the results according to an individual scale;
- Quick view of all the questions, including all comments by shoppers;
- Quick view of the score for each location by groups of questions;
- Comparison by regions and by locations;
- Generating extracts and custom reports as Excel and PDF files, as well as web reports.

You can now filter by several criteria such as: locations, questions, certain periods, maximum score. It also allows saving filters as templates.
Each page, group of questions, region, chart or table can be saved as an extract easily and all extracts can be exported in a single report file. The web report contains the same results; however it is easier to share with a large number of people through a web link with a predetermined validity date.
We will be happy to provide you with more details and demonstrate in person the new capabilities, which we believe are very useful. Your account managers are ready to answer your questions and to assist you right away.

The "Show problematic" toggle reveals only the low scoring questions. It takes one click to switch from tabular to chart view.
We appreciate all feedback; therefore all suggestions for future improvement will be highly appreciated and considered.

